How to forecast a crop's harvest
A late harvest estimate means crews, storage and sales are planned on guesses. Learn a field method you can measure, update and compare with the actual harvest.
- By Aragro Team
- Published
- Updated
- 8 min read
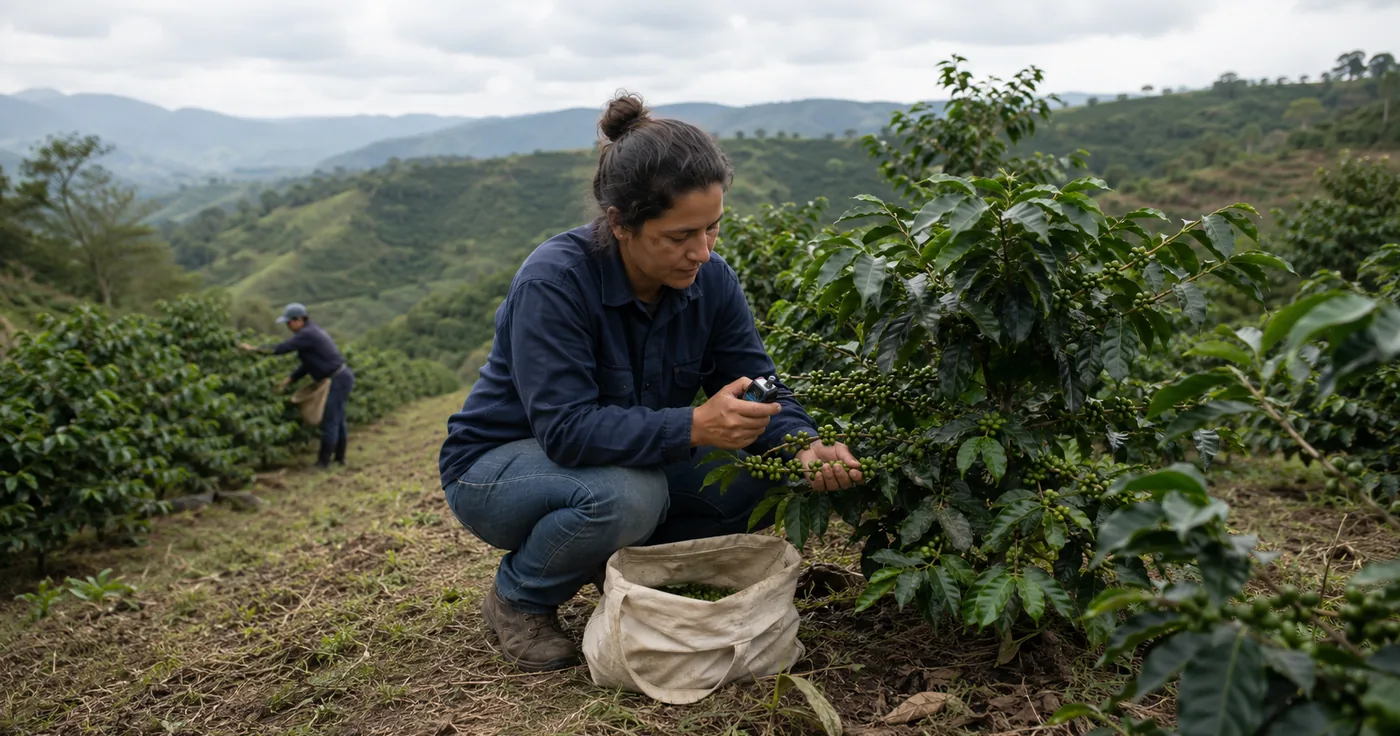
A harvest estimate, or yield forecast, is a pre-harvest calculation of what a crop will produce. It gives the farm a number to plan pickers, transport, storage, sales commitments and cash flow against. It is not a promise: the useful estimate is one with clear, dated assumptions that can be checked against the harvest.
What separates an estimate from the actual harvest
An estimate and a recorded harvest measure different things. The estimate measures the standing crop on a given date and projects the rest of the cycle on an explicit assumption. The US National Agricultural Statistics Service (NASS) states its own plainly: forecasts are based on conditions as of the survey reference date and assume normal conditions for the remainder of the season, and the agency "does not attempt to predict future weather conditions" (USDA NASS, Understanding USDA Crop Forecasts). The actual harvest, by contrast, measures what crossed the scale.
The gap between the two numbers has two parts: what changed after the measurement, and loss in the field. That is why the yield definition recommended in a methodological review commissioned under the FAO Global Strategy is "biological yield minus harvest loss in the field" (Hanuschak, Timely and Accurate Crop Yield Forecasting and Estimation, FAO Global Strategy). NASS measures that loss directly: once the grower has harvested, the enumerator returns and weighs the grain left on the ground. On a farm the expected-loss factor plays that role, calibrated from past harvests.
Formula and worked example
A field estimate scales a representative sample to the productive part of a plot:
Estimated yield = productive area × plant density × average yield per plant × (1 − expected loss)
- Productive area is the planted area after paths, gaps and unplanted zones are removed.
- Plant density is plants standing per unit of area, not necessarily the density originally planted.
- Average yield per plant is the harvestable weight from the sample.
- Expected loss is the share likely to be lost to drop, pests, quality rejects or handling.
| Input | Value |
|---|---|
| Productive area | 2 ha |
| Plant density | 2,500 plants/ha |
| Average yield per plant | 4 kg |
| Expected loss | 10% (0.10) |
| Estimated yield | 2 × 2,500 × 4 × (1 − 0.10) = 18,000 kg |
The same figures are 9,000 kg/ha: 2,500 × 4 × 0.90. Keep that per-area figure as well as the total, since it makes plots of different sizes comparable.
Sampling design: where samples go and how many
Where the sample sits matters as much as how many you take. In the NASS objective yield surveys, the enumerator walks a randomly selected number of paces into the field and marks off a sample plot there "no matter what the condition of the crop at that location". The rule exists to remove the bias of picking convenient plants (USDA NASS, objective yield surveys).
A study of smallholder maize in Ethiopia, published in Food Policy, compared sampling variants against a full harvest of the plot that averaged 59.5 quintals per hectare. Mean absolute error ranged from 23 qt/ha for the farmer's own estimate to 10.6 qt/ha for a randomly placed octant. Three diagonal quadrants gave 16.1 qt/ha against 19.4 qt/ha for a single quadrant placed at the center (Kosmowski et al., 2021). Placing the sample at random improved accuracy more than multiplying quadrants in fixed positions.
Split the plot into zones that differ by soil, slope, variety or planting age, take at least one random sample inside each zone, and weight each zone by its area. Record where each sample was taken so the same design can be repeated on the next pass.
Field procedure
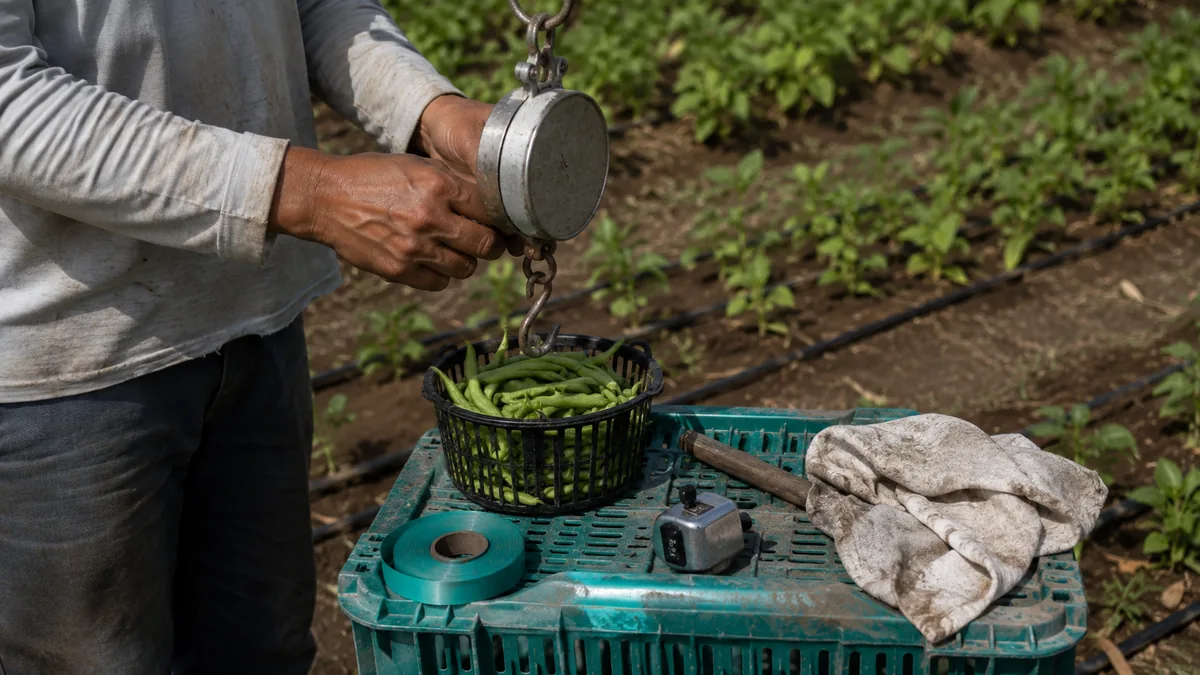
Before measuring, choose a fixed unit — kg, boxes, quintals or 60 and 69 kg sacks — and have a scale; if boxes or sacks are counted, document the assumed weight of each. Keep prior results for the same crop, plot and season when available.
- Map the productive area. Subtract paths, headlands, gaps and unplanted sections.
- Count the stand. Check several sections for gaps, replants and dead plants.
- Take the samples the design calls for. Weigh the harvestable product from each sampled plant or unit and calculate the average.
- Scale and discount. Multiply the average by standing density and productive area, then apply the expected-loss factor.
- Record the result. Date the estimate and retain its area, density, sample method, units and loss assumption. An estimate at fruit set is not comparable with one made two weeks before harvest.
From sample to plot: scaling counts to hectares
A sample gives a weight per sampled unit; the estimate needs it per hectare and then per plot. That conversion is where most errors creep in.
- By area. A 4 × 4 m quadrant is 16 m². If it yields 9.6 kg, that is 0.6 kg/m² and 6,000 kg/ha across the 10,000 m² in a hectare.
- By row. Divide the weight by the meters of row sampled and multiply by 10,000 ÷ row spacing in meters; at 0.8 m spacing that is 12,500 meters of row per hectare.
For a farm total, add the plot totals rather than averaging their per-hectare yields. Three hectares at 6,000 kg/ha plus one at 10,000 kg/ha is 28,000 kg over 4 ha, or 7,000 kg/ha, not the 8,000 kg/ha a simple average would give.
Error, bias and reconciling with the recorded harvest
After harvest, calculate:
Error % = (actual harvest − estimated yield) ÷ estimated yield × 100
A negative result means the estimate was too high. Compare estimates and actuals only within the same crop, plot and season; a greenhouse tomato cycle is not a benchmark for coffee.
| Cycle | Estimated | Actual | Error |
|---|---|---|---|
| 1 | 18,000 kg | 15,900 kg | −11.7% |
| 2 | 16,000 kg | 17,000 kg | +6.3% |
| 3 | 20,000 kg | 18,600 kg | −7.0% |
Bias is the average signed error: (−11.7 + 6.3 − 7.0) ÷ 3 = −4.1%. A persistent sign points to a systematic issue in sampling or the loss factor. Mean absolute error ignores signs: (11.7 + 6.3 + 7.0) ÷ 3 = 8.3%. It shows the uncertainty to allow when committing volume. No system removes that error: the Global Strategy methodological review reports that the US corn forecast, an expensive and mature program, carries a root mean square error of about 6.3 percent four months before harvest, falling to 3 percent two months out. The point of reconciling is not to be right, but to hold a verifiable track record between forecast and final harvest that can correct the method.
Limits of the method and when to re-estimate
Representative sampling cannot remove every limitation: uneven stands or sampling too early can invalidate the assumptions. Volume also does not predict grade, size or price. Do not compare fresh kilograms, 20 kg boxes and quintals without a fixed conversion, and do not mix moisture or quality bases.
That same review puts it simply: the confidence band around a forecast is wider the further it sits from harvest. So re-estimate after establishment, at flowering or fruit set, and one to three weeks before harvest. Repeat it after drought, flooding, hail, a pest outbreak or an irrigation failure. Treat each revision as a new measurement and keep field sheets in your own records.
When an estimate changes, note what changed in the stand, sample or loss factor, and whether the revision reflects a scheduled observation or an event. That way a later error review can separate a weak sampling method from conditions that genuinely changed after the original measurement.
Harvest estimates in Aragro
Aragro's Estimados de cosecha stores the result of the field procedure for a crop cycle alongside the harvest you record. Enter the estimated yield per unit of area (such as 9,000 kg/ha) and the cycle's effective area; an optional unit conversion can reconcile an estimate in one unit with harvest in another. Aragro multiplies yield per area by effective area to show the estimated total beside recorded harvest. Each cycle has one current estimate, while dated field sheets stay in your records. Aragro does not create or revise a field estimate from plant samples, weather, imagery or activity history: sampling, standing counts and expected loss remain field decisions.

Enter the current estimate and effective area in the crop cycle, then record harvests against it. Estimados de cosecha is a Spanish product guide. See the product overview, plans and pricing, and how to run farm payroll for the connected planning context; availability depends on plan and permissions.
Frequently asked questions
How do you calculate expected crop yield?
Multiply productive area by standing plants per area and the average harvestable yield per sampled plant, then discount expected loss: estimated yield = area × plant density × yield per plant × (1 − loss %).
What is the difference between a harvest estimate and the actual harvest?
An estimate measures the standing crop on a given date and projects the rest of the season assuming normal conditions. The actual harvest is the weight recorded on the scale, already net of loss in the field and in handling.
How many samples do you need and where should they be taken?
Take at least one randomly placed sample in each zone of the plot you know differs by soil, slope, variety or planting age, and weight each zone by its area. Where samples sit affects accuracy as much as how many you take.
How do you convert a sample into kilograms per hectare?
Divide the sample weight by the sampled area to get kilograms per square meter, then multiply by 10,000. A 4 × 4 m quadrant yielding 9.6 kg equals 0.6 kg/m² and 6,000 kg/ha.
How accurate is a harvest estimate and when should it be updated?
Measure error against the recorded harvest instead of assuming accuracy. Re-estimate after establishment, at flowering or fruit set, shortly before harvest, and after material weather, pest or irrigation changes.
What does Aragro calculate for a harvest estimate?
Aragro multiplies the estimated yield per unit of area by the crop cycle's effective area and compares the resulting total with recorded harvest. It does not derive a field estimate from samples, weather or imagery.